 OOP - Transformations
Mathematical transformations are usually drawn on hard copy graph paper. This application demonstrates simple transformations. There are four types of transformation shown here, which are Enlargement, which can be positive or negative, Reflection, with a variable line of symmetry, Rotation with a variable centre of rotation and positive and negative angles of rotation, and the fourth transformation is Translation. These are the type of transformations that you're often asked to draw in maths exams...
This is a basic Windows Form containing just a MenuStrip, and four extended Panels, one for each type of transformation. The Form hosts the event handlers for the MouseMove and MouseClick events for all four of the Panels. It also hosts the event handlers for the ValueChanged and KeyPress events for all of the NumericUpDown controls used throughout the application.
The handlers are wired up with AddHandler statements:
AddHandler Enlargement1.MouseMove, AddressOf panels_MouseMove
AddHandler Enlargement1.MouseClick, AddressOf panels_MouseClick
AddHandler Reflection1.MouseMove, AddressOf panels_MouseMove
AddHandler Reflection1.MouseClick, AddressOf panels_MouseClick
AddHandler Rotation1.MouseMove, AddressOf panels_MouseMove
AddHandler Rotation1.MouseClick, AddressOf panels_MouseClick
AddHandler Translation1.MouseMove, AddressOf panels_MouseMove
AddHandler Translation1.MouseClick, AddressOf panels_MouseClick
These are the handlers panels_MouseMove and panels_MouseClick. These two handlers record the user mouse input used in drawing a base shape through clicking on the grid vertices in the graph image...
Private Sub panels_MouseMove(ByVal sender As Object, ByVal e As System.Windows.Forms.MouseEventArgs)
 Dim index As Integer = Array.IndexOf(panels, sender)

 Dim r As Integer = -1
 Dim c As Integer = -1

 For x As Integer = 0 To 16
 If e.Y >= rowY(x) - 3 AndAlso e.Y <= rowY(x) + 3 Then
 r = rowY(x)
 Exit For
 End If
 Next
 For x As Integer = 0 To 16
 If e.X >= columnX(x) - 3 AndAlso e.X <= columnX(x) + 3 Then
 c = columnX(x)
 Exit For
 End If
 Next
 If c > -1 AndAlso r > -1 Then
 sharedVariables.allHighlights(index) = New Point(c, r)
 Else
 sharedVariables.allHighlights(index) = Nothing
 End If
 DirectCast(sender, Panel).Refresh()
End Sub

Private Sub panels_MouseClick(ByVal sender As Object, ByVal e As System.Windows.Forms.MouseEventArgs)
 Dim index As Integer = Array.IndexOf(panels, sender)
 If sharedVariables.allHighlights(index) <> Nothing Then
 If sharedVariables.allVertices(index).Contains(sharedVariables.allHighlights(index)) Then
 sharedVariables.allVertices(index).Remove(sharedVariables.allHighlights(index))
 Else
 sharedVariables.allVertices(index).Add(sharedVariables.allHighlights(index))
 End If
 DirectCast(sender, Panel).Refresh()
 End If
End Sub
The other events handled in the Form code are the ValueChanged and the KeyPress events for all of the NumericUpDown controls used in the application...
AddHandler Enlargement1.nudXPosition.ValueChanged, AddressOf numericupdowns_ValueChanged
AddHandler Enlargement1.nudYPosition.ValueChanged, AddressOf numericupdowns_ValueChanged
AddHandler Enlargement1.nudScale.ValueChanged, AddressOf numericupdowns_ValueChanged
AddHandler Enlargement1.nudXPosition.KeyPress, AddressOf numericupdowns_KeyPress
AddHandler Enlargement1.nudYPosition.KeyPress, AddressOf numericupdowns_KeyPress
AddHandler Enlargement1.nudScale.KeyPress, AddressOf numericupdowns_KeyPress

AddHandler Reflection1.nudIntersection.ValueChanged, AddressOf numericupdowns_ValueChanged
AddHandler Reflection1.nudIntersection.KeyPress, AddressOf numericupdowns_KeyPress

AddHandler Rotation1.nudXCentre.ValueChanged, AddressOf numericupdowns_ValueChanged
AddHandler Rotation1.nudYCentre.ValueChanged, AddressOf numericupdowns_ValueChanged
AddHandler Rotation1.nudAngle.ValueChanged, AddressOf numericupdowns_ValueChanged
AddHandler Rotation1.nudXCentre.KeyPress, AddressOf numericupdowns_KeyPress
AddHandler Rotation1.nudYCentre.KeyPress, AddressOf numericupdowns_KeyPress
AddHandler Rotation1.nudAngle.KeyPress, AddressOf numericupdowns_KeyPress

AddHandler Translation1.nudXPosition.ValueChanged, AddressOf numericupdowns_ValueChanged
AddHandler Translation1.nudYPosition.ValueChanged, AddressOf numericupdowns_ValueChanged
AddHandler Translation1.nudXPosition.KeyPress, AddressOf numericupdowns_KeyPress
AddHandler Translation1.nudYPosition.KeyPress, AddressOf numericupdowns_KeyPress
These are the event handlers for those controls...
The calculations for the transformed shapes are all done in the Panel's paint event. Changing any input just causes the Panel at the top of the z-order to repaint. All of the controls used are primarily value changers for the graphical output.
The KeyPress event is used to restrict user input to just mouse input.
Private Sub numericupdowns_ValueChanged(ByVal sender As System.Object, ByVal e As System.EventArgs)
 Enlargement1.Refresh()
 Reflection1.Refresh()
 Rotation1.Refresh()
 Translation1.Refresh()
End Sub

Private Sub numericupdowns_KeyPress(ByVal sender As System.Object, ByVal e As System.Windows.Forms.KeyPressEventArgs)
 e.Handled = True
End Sub
Three of the Panels have a cross indicator which shows the centre of the transformation, or the offset applied in the transformation. The remaining Panel has a line of symmetry. These serve as a visual representation of the variables used in the transformation
Public Shared Sub drawCross(ByVal g As Graphics, ByVal l As Integer, ByVal t As Integer)
 Dim p As New Pen(Color.LimeGreen, 2)
 g.DrawLine(p, l, t - 10, l, t + 10)
 g.DrawLine(p, l - 10, t, l + 10, t)
End Sub
Public Shared Sub drawMirrorLine(ByVal g As Graphics, ByVal l As Integer, ByVal t As Integer, ByVal v As Integer, ByVal x As Integer)
 Dim p As New Pen(Color.LimeGreen, 2)
 p.DashStyle = Drawing2D.DashStyle.Dash

 Dim diagonals() As Integer = {5, 4, 3, 2, 1, 0, 1, 2, 3, 4, 5}

 Dim x1 As Integer
 Dim y1 As Integer
 Dim x2 As Integer
 Dim y2 As Integer

 Select Case x
 Case 0 'Vertical
 g.drawLine(p, l, 25, l, 425)
 Case 1 'Horizontal
 g.drawLine(p, 25, t, 425, t)
 Case 2 'Diagonal - SW to NE
 If v <= 2 Then
 x1 = 25 + diagonals(v + 3) * 25
 y1 = 425
 x2 = 425
 y2 = 25 + diagonals(v + 3) * 25
 Else
 x1 = 25
 y1 = 425 - diagonals(v + 3) * 25
 x2 = 425 - diagonals(v + 3) * 25
 y2 = 25
 End If
 g.drawLine(p, x1, y1, x2, y2)
 Case 3 'Diagonal - NW to SE
 If v <= 2 Then
 x1 = 25
 y1 = 25 + diagonals(v + 3) * 25
 x2 = 25 + (16 - diagonals(v + 3)) * 25
 y2 = 425
 Else
 x1 = 25 + diagonals(v + 3) * 25
 y1 = 25
 x2 = 425
 y2 = 25 + (16 - diagonals(v + 3)) * 25
 End If
 g.drawLine(p, x1, y1, x2, y2)
 End Select

End Sub
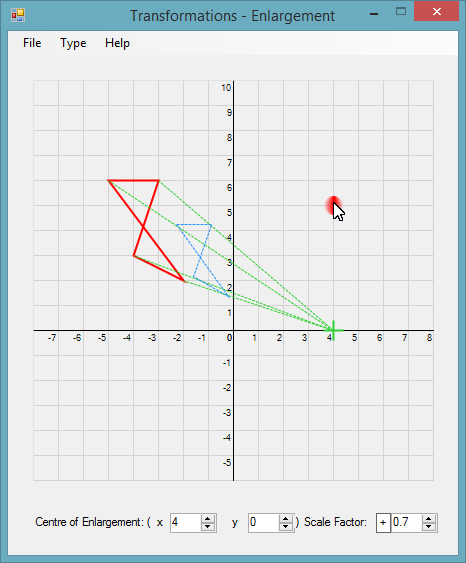
The first of the extended Panels is the Enlargement Panel...
As you can see, mouse hovering over a grid vertex highlights that vertex.
The code for the Enlargement Panel is fairly simple.
The overridden Paint method is the coordinating procedure for all of the various drawing methods used.
Protected Overrides Sub OnPaint(ByVal e As System.Windows.Forms.PaintEventArgs)
 e.Graphics.SmoothingMode = Drawing2D.SmoothingMode.HighQuality

 methods.drawGrid(e.Graphics, Me.Font)

 Dim l As Integer = pointMethods.c2X(CInt(nudXPosition.Value))
 Dim t As Integer = pointMethods.r2Y(CInt(nudYPosition.Value))
 Dim s As Decimal = nudScale.Value

 methods.drawShape(e.Graphics, sharedVariables.allVertices(0))
 methods.drawEnlargedShape(e.Graphics, l, t, s, lblPolarity.Text, sharedVariables.allVertices(0))
 methods.drawBorders(e.Graphics, Me.BackColor)
 methods.drawCross(e.Graphics, l, t)
 methods.drawHighlight(e.Graphics, sharedVariables.allHighlights(0))

 MyBase.OnPaint(e)
End Sub
There are two other handlers contained in the Enlargement Panel code...
One is for a context menu providing a simple way to clear a drawing. The other is the Click handler for the positive/negative Label. Clicking the Label changes the text of the Label, and causes a repaint.
Private Sub ClearToolStripMenuItem_Click(ByVal sender As System.Object, ByVal e As System.EventArgs) Handles ClearToolStripMenuItem.Click
 sharedVariables.allVertices(0).Clear()
 Me.Refresh()
End Sub

Private Sub lblPolarity_Click(ByVal sender As System.Object, ByVal e As System.EventArgs) Handles lblPolarity.Click
 If lblPolarity.Text = "+" Then lblPolarity.Text = "-" Else lblPolarity.Text = "+"
 Me.Refresh()
End Sub
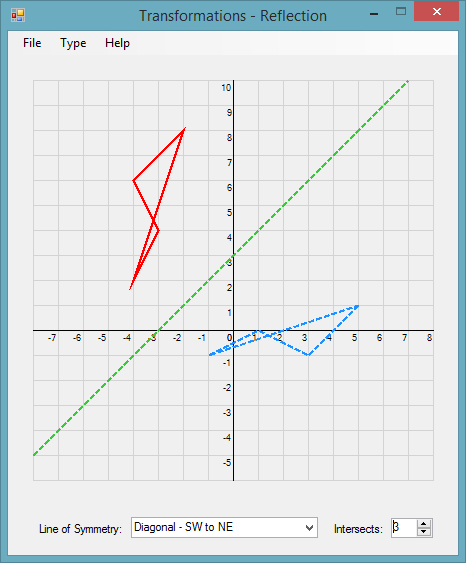
This is how the Reflection Panel appears at run time...
The overridden Paint event is again kept very simple, calling a series of helper methods, each performing a single task...
Protected Overrides Sub OnPaint(ByVal e As System.Windows.Forms.PaintEventArgs)

 methods.drawGrid(e.Graphics, Me.Font)

 Dim l As Integer = 25 + ((CInt(nudIntersection.Value) + 8) * 25)
 Dim t As Integer = 25 + (Math.Abs(CInt(nudIntersection.Value) - 10) * 25)
 Dim v As Integer = CInt(nudIntersection.Value)

 methods.drawMirrorLine(e.Graphics, l, t, v, cboLine.SelectedIndex)
 methods.drawShape(e.Graphics, sharedVariables.allVertices(1))
 methods.drawMirrorShape(e.Graphics, sharedVariables.allVertices(1), v, cboLine.SelectedIndex)
 methods.drawBorders(e.Graphics, Me.BackColor)
 methods.drawHighlight(e.Graphics, sharedVariables.allHighlights(1))

 MyBase.OnPaint(e)
End Sub
There are two other events handled, which are local to the Reflection Panel.
The first is a context menu click handler. All of the Panels have an encapsulated context menu.
The second handler is for the ComboBox used in choosing where to place the line of symmetry.
Private Sub ClearToolStripMenuItem_Click(ByVal sender As System.Object, ByVal e As System.EventArgs) Handles ClearToolStripMenuItem.Click
 sharedVariables.allVertices(1).Clear()
 Me.Refresh()
End Sub

Private Sub cboLine_SelectedIndexChanged(ByVal sender As System.Object, ByVal e As System.EventArgs) Handles cboLine.SelectedIndexChanged
 nudIntersection.Value = 0
 nudIntersection.Minimum = -3
 Me.Refresh()
End Sub
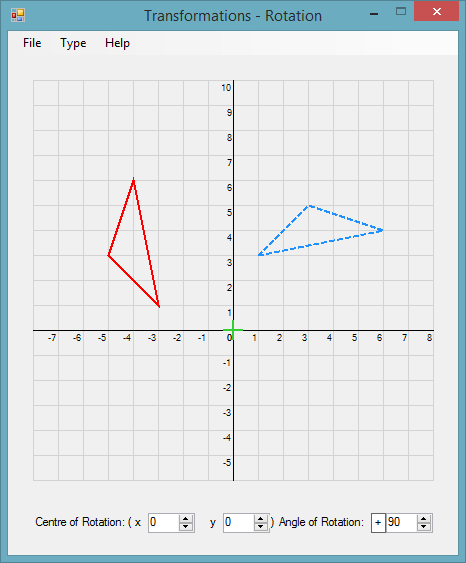
This is how the Rotation Panel appears at run time...
Continuing the application-wide theme, the Rotation Panel Paint event is neat and kept simple...
Protected Overrides Sub OnPaint(ByVal e As System.Windows.Forms.PaintEventArgs)

 methods.drawGrid(e.Graphics, Me.Font)

 Dim l As Integer = 25 + ((CInt(nudXCentre.Value) + 8) * 25)
 Dim t As Integer = 25 + (Math.Abs(CInt(nudYCentre.Value) - 10) * 25)
 Dim v As Integer = CInt(nudAngle.Value)

 methods.drawShape(e.Graphics, sharedVariables.allVertices(2))
 methods.drawRotatedShape(e.Graphics, sharedVariables.allVertices(2), v, l, t, lblPolarity.Text)
 methods.drawBorders(e.Graphics, Me.BackColor)
 methods.drawCross(e.Graphics, l, t)
 methods.drawHighlight(e.Graphics, sharedVariables.allHighlights(2))

 MyBase.OnPaint(e)
End Sub
This Panel also has a context menu and a polarity Label...
Private Sub lblPolarity_Click(ByVal sender As System.Object, ByVal e As System.EventArgs) Handles lblPolarity.Click
 If lblPolarity.Text = "-" Then lblPolarity.Text = "+" Else lblPolarity.Text = "-"
 Me.Refresh()
End Sub

Private Sub ClearToolStripMenuItem_Click(ByVal sender As System.Object, ByVal e As System.EventArgs) Handles ClearToolStripMenuItem.Click
 sharedVariables.allVertices(2).Clear()
 Me.Refresh()
End Sub
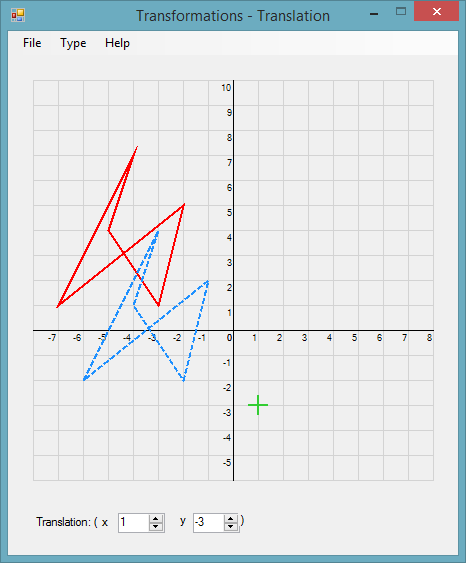
This is how the fourth Panel appears at runtime...
Again the code is concise and easy to read...
Protected Overrides Sub OnPaint(ByVal e As System.Windows.Forms.PaintEventArgs)

 methods.drawGrid(e.Graphics, Me.Font)

 Dim l As Integer = 25 + ((CInt(nudXPosition.Value) + 8) * 25)
 Dim t As Integer = 25 + (Math.Abs(CInt(nudYPosition.Value) - 10) * 25)

 methods.drawShape(e.Graphics, sharedVariables.allVertices(3))
 methods.drawTranslatedShape(e.Graphics, sharedVariables.allVertices(3), l, t)
 methods.drawBorders(e.Graphics, Me.BackColor)
 methods.drawCross(e.Graphics, l, t)
 methods.drawHighlight(e.Graphics, sharedVariables.allHighlights(3))

 MyBase.OnPaint(e)
End Sub
The Translation Panel, as all the other Panels, has a context menu
Private Sub ClearToolStripMenuItem_Click(ByVal sender As System.Object, ByVal e As System.EventArgs) Handles ClearToolStripMenuItem.Click
 sharedVariables.allVertices(3).Clear()
 Me.Refresh()
End Sub
drawGrid is common to all of the Panels. It draws the 'Graph' grid and labels.
Public Shared Sub drawGrid(ByVal g As Graphics, ByVal f As Font)
 g.DrawRectangle(Pens.LightGray, New Rectangle(25, 25, 400, 400))

 For c As Integer = 50 To 400 Step 25
 g.DrawLine(Pens.LightGray, c, 25, c, 425)
 Next
 For r As Integer = 50 To 400 Step 25
 g.DrawLine(Pens.LightGray, 25, r, 425, r)
 Next

 g.DrawLine(Pens.Black, 225, 25, 225, 425)
 g.DrawLine(Pens.Black, 25, 275, 425, 275)

 Dim lblWidth As Integer

 For x As Integer = -8 To 8
 lblWidth = CInt(g.MeasureString(x.ToString, New Font(f.FontFamily, 7)).Width)
 g.DrawString(x.ToString, New Font(f.FontFamily, 7), Brushes.Black, 25 + ((x + 8) * 25) - lblWidth, 276)
 Next

 For y As Integer = -6 To 10
 lblWidth = CInt(g.MeasureString(y.ToString, New Font(f.FontFamily, 7)).Width)
 g.DrawString(y.ToString, New Font(f.FontFamily, 7), Brushes.Black, 225 - lblWidth, 426 - (y + 6) * 25)
 Next
End Sub
drawShape is common to all of the Panels. The main difference in the four Panels' Paint event is one unique drawing method for each Panel...
Public Shared Sub drawShape(ByVal g As Graphics, ByVal vertices As List(Of Point))
 If vertices.Count > 2 Then
 g.DrawPolygon(New Pen(Color.Red, 2), vertices.ToArray)
 Else
 For x As Integer = 0 To vertices.Count - 1
 g.FillEllipse(Brushes.Red, New Rectangle(vertices(x).X - 3, vertices(x).Y - 3, 6, 6))
 Next
 End If
End Sub
This contains all of the calculations used in rendering an enlarged shape...
Public Shared Sub drawEnlargedShape(ByVal g As Graphics, ByVal l As Integer, ByVal t As Integer, ByVal s As Decimal, ByVal polarity As String, ByVal vertices As List(Of Point))
 If vertices.Count >= 3 Then
 Dim pen As New Pen(Color.LimeGreen)
 pen.DashStyle = Drawing2D.DashStyle.Dash

 Dim newPoints As New List(Of Point)()

 For x As Integer = 0 To vertices.Count - 1
 Dim distance As Single = measurement.lineLength(New Point(l, t), vertices(x))
 Dim angle As Double = (If(polarity.Equals("+"), 360, 180)) - angles.FindAngle(New Point(l, t), vertices(x))

 Dim scaleDistance As Decimal = CDec(distance * s)

 'Turn degrees to radians (because of the sin and cos operations)
 Dim angleRadians As Double = angle * (Math.PI / 180)

 'Calculate X1 And Y1
 Dim pointX1 As Integer = CInt(l + Math.Cos(angleRadians) * scaleDistance)
 Dim pointY1 As Integer = CInt(t - Math.Sin(angleRadians) * scaleDistance)

 newPoints.Add(New Point(pointX1, pointY1))
 Next

 If polarity.Equals("+") Then
 For x As Integer = 0 To vertices.Count - 1
 g.DrawLine(pen, l, t, If(s > 1D, newPoints(x).X, vertices(x).X), If(s > 1D, newPoints(x).Y, vertices(x).Y))
 Next
 Else
 For x As Integer = 0 To vertices.Count - 1
 g.DrawLine(pen, l, t, vertices(x).X, vertices(x).Y)
 g.DrawLine(pen, l, t, newPoints(x).X, newPoints(x).Y)
 Next
 End If

 Dim pen2 As New Pen(Color.DodgerBlue)
 pen2.DashStyle = Drawing2D.DashStyle.Dash

 g.DrawPolygon(pen2, newPoints.ToArray)
 End If
End Sub
This again contains all of the calculations needed for the specified transformation...
Public Shared Sub drawMirrorShape(ByVal g As Graphics, ByVal vertices As List(Of Point), ByVal v As Integer, ByVal x As Integer)
 If vertices.Count < 3 Then
 Return
 End If

 Dim pen As New Pen(Color.DodgerBlue, 2)
 pen.DashStyle = Drawing2D.DashStyle.Dash

 Dim gridPoints As New List(Of Point)
 For Each p As Point In vertices
 gridPoints.Add(New Point(pointMethods.X2c(p.X), pointMethods.Y2r(p.Y)))
 Next p

 Dim reflectionPoints As New List(Of Point)
 Select Case x
 Case 0 'Vertical
 For Each p As Point In gridPoints
 reflectionPoints.Add(New Point(pointMethods.swapPolarity(p.X - v) + v, p.Y))
 Next p
 Case 1 'Horizontal
 For Each p As Point In gridPoints
 reflectionPoints.Add(New Point(p.X, pointMethods.swapPolarity(p.Y - v) + v))
 Next p
 Case 2 'Diagonal - SW to NE
 For Each p As Point In gridPoints
 reflectionPoints.Add(New Point(p.Y - v, p.X + v))
 Next p
 Case 3 'Diagonal - NW to SE
 For Each p As Point In gridPoints
 reflectionPoints.Add(New Point(pointMethods.swapPolarity(p.Y - v), pointMethods.swapPolarity(p.X) + v))
 Next p
 End Select

 Dim reflectionCoordinates As New List(Of Point)
 For Each p As Point In reflectionPoints
 reflectionCoordinates.Add(New Point(pointMethods.c2X(p.X), pointMethods.r2Y(p.Y)))
 Next

 g.DrawPolygon(pen, reflectionCoordinates.ToArray)

End Sub
This contains all of the calculations necessary to draw a rotation transformation...
Public Shared Sub drawRotatedShape(ByVal g As Graphics, ByVal vertices As List(Of Point), ByVal r As Integer, ByVal l As Integer, ByVal t As Integer, ByVal polarity As String)
 If vertices.Count < 3 Then
 Return
 End If

 Dim pen As New Pen(Color.DodgerBlue, 2)
 pen.DashStyle = Drawing2D.DashStyle.Dash

 Dim gridPoints As New List(Of Point)
 For Each p As Point In vertices
 gridPoints.Add(New Point(pointMethods.X2c(p.X), pointMethods.Y2r(p.Y)))
 Next p

 l = pointMethods.X2c(l)
 t = pointMethods.Y2r(t)

 Dim rotationPoints As New List(Of Point)

 Select Case polarity & r.ToString()
 Case "+90", "-270"
 For Each p As Point In gridPoints
 rotationPoints.Add(New Point((p.Y - t) + l, -(p.X - l) + t))
 Next p
 Case "-180", "+180"
 For Each p As Point In gridPoints
 rotationPoints.Add(New Point(-(p.X - l) + l, -(p.Y - t) + t))
 Next p
 Case "+270", "-90"
 For Each p As Point In gridPoints
 rotationPoints.Add(New Point(-(p.Y - t) + l, p.X - l + t))
 Next p
 Case Else
 For Each p As Point In gridPoints
 rotationPoints.Add(New Point(p.X, p.Y))
 Next p
 End Select

 Dim rotationCoordinates As New List(Of Point)
 For Each p As Point In rotationPoints
 rotationCoordinates.Add(New Point(pointMethods.c2X(p.X), pointMethods.r2Y(p.Y)))
 Next

 g.DrawPolygon(pen, rotationCoordinates.ToArray)

End Sub
This is the simplest of the transformations. A translated shape is simply offset from the original shape...
Public Shared Sub drawTranslatedShape(ByVal g As Graphics, ByVal vertices As List(Of Point), ByVal l As Integer, ByVal t As Integer)
 If vertices.Count < 3 Then
 Return
 End If

 Dim pen As New Pen(Color.DodgerBlue, 2)
 pen.DashStyle = Drawing2D.DashStyle.Dash

 Dim gridPoints As New List(Of Point)
 For Each p As Point In vertices
 gridPoints.Add(New Point(pointMethods.X2c(p.X), pointMethods.Y2r(p.Y)))
 Next p

 l = pointMethods.X2c(l)
 t = pointMethods.Y2r(t)

 Dim translationPoints As New List(Of Point)

 For Each p As Point In gridPoints
 translationPoints.Add(New Point(p.X + l, p.Y + t))
 Next p

 Dim translationCoordinates As New List(Of Point)
 For Each p As Point In translationPoints
 translationCoordinates.Add(New Point(pointMethods.c2X(p.X), pointMethods.r2Y(p.Y)))
 Next

 g.DrawPolygon(pen, translationCoordinates.ToArray)

End Sub
This ensures any overhanging drawing is truncated at the bounds of the 'Graph paper' grid...
Public Shared Sub drawBorders(ByVal g As Graphics, ByVal c As Color)
 g.FillRectangle(New SolidBrush(c), New Rectangle(0, 0, 25, 500))
 g.FillRectangle(New SolidBrush(c), New Rectangle(426, 0, 25, 500))
 g.FillRectangle(New SolidBrush(c), New Rectangle(0, 0, 450, 25))
 g.FillRectangle(New SolidBrush(c), New Rectangle(0, 426, 450, 75))
End Sub
This is the last drawing method. It draws the mouse hover highlighting on the grids...
Public Shared Sub drawHighlight(ByVal g As Graphics, ByVal highlight As Point)
 If highlight <> Nothing Then
 Dim shadowPath As New Drawing.Drawing2D.GraphicsPath
 shadowPath.AddEllipse(New Rectangle(highlight.X - 10, highlight.Y - 10, 20, 20))
 Using pgb As New Drawing2D.PathGradientBrush(shadowPath)
 'Normal
 pgb.CenterColor = Color.Red  'This is the real one
 pgb.SurroundColors = New Color() {Color.Transparent}
 pgb.FocusScales = New PointF(0.1F, 1.0F)

 g.FillPath(pgb, shadowPath)
 End Using
 End If
End Sub
(Each grid cell is 25*25 pixels.)
These convert grid coordinates to pixel coordinates...
Public Shared Function c2X(ByVal x As Integer) As Integer
 Return 25 + (x + 8) * 25
End Function

Public Shared Function r2Y(ByVal y As Integer) As Integer
 If y <= 10 Then
 Return 25 + (CInt(Math.Abs(y - 10)) * 25)
 Else
 Return 25 + ((10 - y) * 25)
 End If
End Function
These convert pixel coordinates to grid coordinates.
Public Shared Function X2c(ByVal x As Integer) As Integer
 Dim c As Integer = ((x - 25) \ 25)

 If c <= 8 Then
 Return -(8 - c)
 Else
 Return (c - 8)
 End If
End Function

Public Shared Function Y2r(ByVal y As Integer) As Integer
 Dim r As Integer = (y - 25) \ 25

 Return (10 - r)
End Function
This is used in plotting points...
Public Shared Function swapPolarity(ByVal x As Integer) As Integer
 Return -x
End Function
Graphical programming in VB.Net can be challenging and rewarding. This application relies on GDI+ methods and some fairly simple coding methods to achieve its aim.
The code behind the transformations used for plotting, is a simplified implementation of some commonly used methods in the world of Mathematics. Using a 'Graph paper' type grid and only drawing vertex to vertex, makes plotting the transformations a simple task.
You can download the example project here
Download the compiled version here